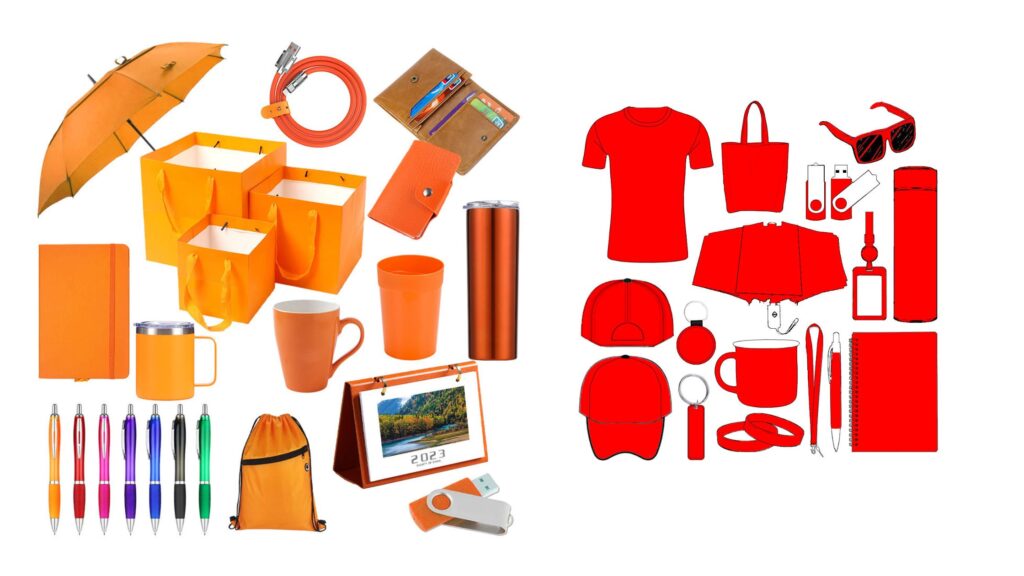
Promotional products are physical items printed with your logo and given away rather than sold. That definition covers everything from a two-dollar bottle opener to a branded zip-up hoodie. And almost every article answering “what promotional products are most effective?” will hand you the same ranked list, sorted the same way.
Here is the honest answer, right at the top: there is no single most effective promotional product, because “effective” is three different jobs.
If you want the most people to see your logo once, apparel wins. If you want the item used every single day, plain writing instruments beat it. And if you sell through bars, restaurants or taprooms, none of those rankings were built for you. Half the items that work hardest there never leave the room.
Let’s take those one at a time, with the actual numbers behind them.
1. What Does “Most Effective” Actually Mean?
Most buyers ask this question as if there is one scoreboard. There are four, and the winner is different on each one.
| The job you’re really buying | The measure that fits | Who wins | The number |
|---|---|---|---|
| Reach — being seen a lot | Lifetime views per item | Fleece and jackets | 9,000 views |
| Habit — being used daily | How often it comes out | Writing instruments | 64% use theirs daily |
| Better opinion | % who see you more favourably | Blankets and health items | 88% and 86% |
| Purchase intent | % more likely to do business | Food gifts | 92% |
The finding that changes the whole answer
Here is the single most useful thing in ASI’s 2026 study, and nobody ranking products mentions it.
ASI asked consumers two separate questions. First: what would you be most excited to receive? Second: would you be more likely to do business with whoever gave you each item?
T-shirts came first on the excitement list at 55% — the most wanted promotional product in America.
T-shirts came sixteenth out of nineteen on driving business, at 69%. Food gifts topped that list at 92%. Blankets came second at 87%.
Meanwhile writing instruments were wanted by only 36% of people — eighth from the bottom — yet they beat T-shirts on both relationship measures:
- 84% view the advertiser more favourably after a pen, against 68% after a T-shirt.
- 77% say they’d be more likely to do business, against 69%.
So the product people most want to receive is one of the weakest at changing how they behave. What people say they want and what actually moves them are two different lists.
Why? The pen sits on the desk. The T-shirt competes with everything else in someone’s wardrobe — including fit, size, and whether the last one they got was rubbish.
PPAI’s data backs the same point from another angle. PPAI’s Product Power 2026 study surveyed more than 5,000 US consumers. Released in December 2025, it names three things that make merch feel cheap or forgettable: low durability, poor design, and irrelevance. Two of those three have nothing to do with how many people see the logo.
What this means for you: before comparing two products, write down which of the four jobs you’re buying. A trade show handout aims at reach. A distributor gift aims at intent. Buying for the wrong job is why good merch fails.
2. How Do You Measure Whether a Promotional Product Works?
The industry standard is cost per impression, and the formula is simple:
> Cost per impression = your unit cost ÷ (how long it’s kept × how often it’s used × how many people see it in use)
ASI’s own report gives you the two anchor averages: 3,300 lifetime views per item, at an average cost per impression of six tenths of a cent. Across the whole US sample, 78% view the advertiser more favourably and 76% are more likely to do business after receiving something.
Here are the categories most beer buyers actually compare, all read from ASI’s published 2026 report:
| Category | Lifetime views | Cost per impression | More likely to do business |
|---|---|---|---|
| Fleece / jackets | 9,000 | 4/10 of a cent | 83% |
| Bags | 4,900 | 1/10 of a cent | 77% |
| Headwear | 4,000 | — | 72% |
| T-shirts | 3,500 | 1/3 of a cent | 69% |
| Polos | 2,900 | 7/10 of a cent | 72% |
| Umbrellas | 2,300 | 7/10 of a cent | 76% |
| Writing instruments | 1,900 | 1/10 of a cent | 77% |
| Power banks | 1,800 | 7/10 of a cent | 81% |
| Drinkware | 1,300 | 1 cent | 74% |
Read the “lifetime views” column next to the last column and the whole ranking argument falls apart. Fleece gets 9,000 views and an 83% business score. Writing instruments get barely a fifth of those views and score 77%. Drinkware sits second from bottom on views, and still converts better than T-shirts, polos or caps.
The important caveat nobody leads with
These figures are modelled, not counted. Nobody followed thousands of people around with a clipboard. A lifetime view count comes from asking people how long they keep things, how often they use them, and who sees them.
That doesn’t make the numbers useless. It changes what you can use them for:
- ✅ Good for: shortlisting, and comparing two quotes on similar items. If one is genuinely used daily and another monthly, the maths holds up.
- ❌ Bad for: defending a budget line. “ASI says 3,300 views” is not a measurement of your order.
And be careful where you read them. We compared the numbers above against the tables circulating on distributor blogs. Most match the report. One widely copied table lists health and safety products at 4,000 lifetime views. ASI’s own report puts them at 400. Ten times out. If a number is going in front of a client, check it against the source.
What this means for you: use these charts to shortlist, not to report. Section 5 covers what you can actually count yourself.
3. Why Do Category Averages Mislead Buyers?
Because a category average mixes dollar-store items with premium ones into a single number.
The “drinkware” row above is a good example. ASI’s 2026 figures say two things. First, 87% keep a branded drink because it’s useful — the top keep reason in the whole study. Second, 77% use it weekly or more, and 80% keep it over a year. A thin pint glass that goes cloudy after thirty washes and a double-wall tumbler are both just “drinkware.” They share nothing else.
Here is the cleanest proof available, and it may surprise you. ASI puts fleece and jackets at 4/10 of a cent per impression. A plain T-shirt costs 1/3 of a cent. The dear item costs barely more per view than the cheap one, because a longer life cancels out the higher price.
> Price is not the variable. Lifespan is.
Which leads to the most useful buying rule in this whole article:
With a fixed budget, upgrading the spec usually beats switching the category. Going from a thin tee to a heavyweight one is a bigger lever than moving from tees to hats. And moving from standard on-glaze printing to laser-etched or under-glaze decoration matters more than either.
Ask your supplier for two quotes on the *same* item at two different specs. Compare those. That comparison actually belongs to your order. The category chart doesn’t.
Our promo material guide goes through what sits behind a spec — the six material families and where each one fails first.
4. Which Products Actually Work Best for Beer Brands?
Everything above comes from general promotional merchandise research, mostly US consumer samples. Beer runs on different rules, because a large share of what you buy does not get taken home.
Split your list in two:
Items that leave the venue
These follow the standard maths above. Someone takes the item home, uses it, and views accumulate — so the ASI model genuinely applies.
| Item | Best at | What decides whether it works |
|---|---|---|
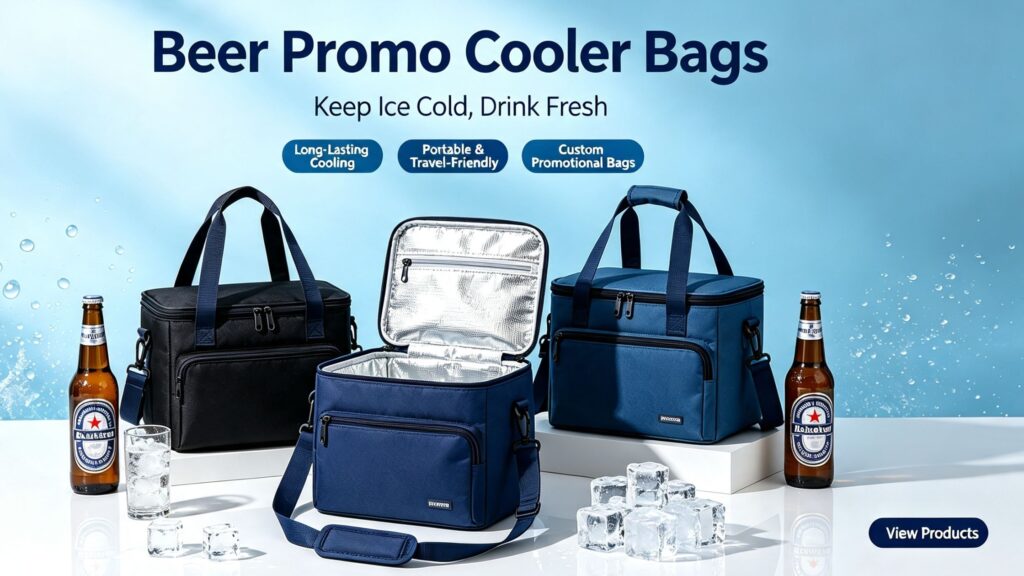
| Cooler bags | Longest consumer life of anything here | Fabric weight, lining, insulation thickness |
| Can coolers and bottle openers | Daily use at tiny unit cost | Whether it’s actually kept, not handed out |
| Branded mugs and glasses | Being looked at for a whole drink | Print method vs dishwasher cycles |
| Printed drink glasses | Perceived value above cost | Glass quality vs logo placement |
| Growlers and steins | Gifting and loyalty | Steel grade or glaze route (see below) |
Two specs worth arguing about with your supplier, because both change the cost far more than the quote admits:
Steel grade. Two grades get sold as “stainless steel.” Three, actually: AISI 304 is the food-contact standard. AISI 201 costs less and rusts far sooner in wet service. AISI 430 is magnetic — fine for trays, not for drinkware. Two of those can sit 20–35% apart on price and years apart on service life. Write the grade into your PI.
How the logo goes on. Etching and sandblasting put the mark *into* the surface. Screen print and UV print sit *on top* and can wear. Our beer mug explainer covers why that distinction decides whether your glass survives a commercial kitchen.
Items that stay put — and why no ranking covers them
This is the part every “most effective promotional products” list misses, including ours until now.
ASI’s whole model assumes the item gets kept. But half the strongest beer-brand materials are installed, not received. A bar mat, a tap handle, a coaster, a tin sign, a table tent or a serving tray doesn’t get carried home. It gets looked at hundreds of times a night, in the same place, by people holding your product.
So the model that applies here is not retention. It’s traffic:
> Views = (people who pass or sit at that spot each day) × (days it stays installed)
Fill it in with your own venue numbers. A bar mat facing 120 covers a night, kept down 300 nights a year, is being looked at roughly 36,000 times. At a few dollars landed, that works out well under a hundredth of a cent per view — cheaper per view than any take-home category in the ASI table.
One honest caveat, because it matters. Those views repeat the same regulars. They are not 36,000 new people. What they buy you is frequency with exactly the audience you want: someone standing at your bar deciding what to drink. Take-home items give you reach to strangers. Installed items give you repetition at the point of decision. Those are different products doing different jobs — which is precisely the point of Section 1.
And this audience is not shrinking, which is why the point holds. The Brewers Association, reporting in July 2026, found taprooms were the best-performing brewery type in the first half of the year. Distributed draught gained channel share. Packaged lost it. Consumers went the same way: a Brewers Association and Harris Poll survey found brewery visits rose from 5.1 to 5.5 per person per year.
People are still going to the venue. That’s where your logo needs to be.
To see what actually gets fitted up in a real venue, read how to choose beer POSM and our guides to custom beer POSM and retail displays and signage. Our display ideas page shows what the space usually allows.
Matching the item to where it has to work
Note the axis here: channel first, then what you measure, then what wins. We cover the item-by-item landscape in branded promotional items, so this table stays on how you score the result.
| Where it runs | What “effective” means here | Usually the strongest | Check before you order |
|---|---|---|---|
| Taproom or bar counter | Repetition at the decision point | Mats, coasters, tap handles, glassware | How long the venue will actually keep it out |
| Retail shelf | Eye landing on the crate, unaided | Shelf displays, tin tackers, brewery signs | Measured shelf depth — unsolicited displays stay in the stockroom |
| Festival and outdoor | Surviving the weekend | Canopy tents, umbrellas, cooler bags | Wind rating and frame weight; UV-stable ink |
| Trade and distributor | The customer keeps using it | Bar mats, trays, bar serving supplies | Does it make life easier for the venue |
| Consumer merch | Being worn in public | Apparel, beach mats, chairs | Fabric weight and fit beat quantity every time |
| Gift with purchase | Felt worth more than it cost | Ice buckets, insulated buckets, gift sets | Packaging often costs more than the item |
5. Can You Actually Measure This on Your Own Order?
Yes, and you should — because Section 2’s numbers are estimates and these are counts.
Three you can run without a research budget:
1. Put something countable on the item. A short URL, a QR code or a campaign code. Count the hits. This turns every item into a measurable placement. 2. Track named recipients. For trade programmes, you already know who got one. Watch those accounts’ re-order rates against a comparable list that got nothing. 3. Ask the venue. For installed items, three months in, ask staff whether it’s still out and still clean. That single question tells you more than any impression model.
⚠️ Before you print a QR code: build the landing page first and check it loads fast on a phone, on a wet table, in bad light. A code that 404s costs you the whole print run.
What this means for you: don’t tell your finance chief “ASI says 3,300 views.” Tell them this: “these 400 named accounts re-ordered 18% more than the control group.” Your own number beats anyone’s average.
6. What Should You Decide Before You Ask for a Quote?
Bad logistics kills more campaigns than bad design does. Run down this list first.
| Decision | The question to ask | Why it changes the outcome |
|---|---|---|
| MOQ | Is that 1,000 total, 1,000 per logo, or 1,000 per colour? | Splitting one order across regional versions can fail every minimum at once |
| Samples | Is this the production spec, or a stock item decorated fast? | A sample built to a different spec proves nothing |
| Lead time | Which date does that cover — artwork, sample, bulk, port? | Our lead time guide breaks the gates |
| Freight | Is that quoted FOB or landed? | On bulky items like tents or our barware buying guide, freight moves landed cost more than unit price does |
| Payment | What deposit, and what balance terms on re-order? | A re-order priced like the first one is a costing mistake, not a loyalty perk |
| Duty and origin | Which factory, and which country does the paperwork name? | Two origins with two spec sheets is the working hedge for hard goods |
| Compliance | Which test report arrives with the goods? | Food-contact items need the right paper for your market, not a generic “certificate” |
Two of these deserve a click if you’ve never bought from China before: how to compare MOQs and what to check before shipping.
And before you commit to a name: read how to find promotional product suppliers in China and the questions to ask them. If a supplier can’t tell you which factory makes your item, that answer tells you something.
7. How Much Do the Most Effective Options Cost?
We’ll give you bands rather than prices, because our prices aren’t your prices and unit cost moves weekly. Treat these as a rough guide, not a promise.
A more useful way to read cost is by *what you’re paying for*, since that’s where each one hides its costs:
| What you’re buying | Typical examples | Where the cost actually hides | Rough band |
|---|---|---|---|
| Daily use | Coasters, bar mats, drinkware | Spec grade and print durability — wash cycles, not unit price | $ to $$ |
| Repeated public wear | Tees, hoodies, caps | Fabric weight, fit, number of print passes | $$ |
| A fixed position | Tap handles, displays, brand walls, brewery signs | Freight, installation, retailer approval | $$$ to $$$$ |
| A gift moment | Steins, trays, plastic buckets, gift sets | Packaging, and the minimum per version | $$ to $$$ |
Note where each one hides its cost. You don’t lose money on the ceramic. You lose it on a display rack nobody installed.
For the full cost picture on buying from China — including what most buyers miss — see how to source beer promotional products from China and how to import bar supplies. Buyers who want to see the ground truth in person start with China’s wholesale markets.
Frequently Asked Questions
What promotional products are most effective?
It depends on the job you’re buying, and this is where the popular lists go wrong.
For raw reach, fleece and jackets win, at 9,000 lifetime views. But ask the more useful question — will this make someone likelier to buy from me? — and the ranking changes completely. T-shirts are the product most Americans say they want, at 55%. They rank sixteenth of nineteen on driving business, at 69%. Writing instruments, wanted by only 36%, beat them on both trust and intent.
Is there one product that always works?
No, and any supplier who says otherwise is selling you their margin line. What predicts success across every category is use frequency. Daily-use items win on the relationship measures in ASI’s own data. Reach alone has never been the strongest predictor.
Are cheap giveaways worth it?
Sometimes, and never for the reason people think. A cheap item that gets used daily beats an expensive one that doesn’t. But if nobody uses it, the cost per impression is infinite — you paid, and got nothing. Order fewer, specify better.
How do I measure promotional product ROI?
Use the standard formula — unit cost divided by lifetime views — for shortlisting, then measure something you can actually count. Campaign codes, named-account re-orders, and whether the venue still has it out three months later beat any industry average.
Which products work best for a bar or taproom?
The ones that stay installed. Bar mats, tap handles, coasters, glassware and signage earn views on every service. No industry ranking measures them, because nobody ever “keeps” them. Brewers Association data shows brewery visits rising, so that audience is not shrinking.
What makes people throw promotional products away?
PPAI’s Product Power 2026 study names three causes: low durability, poor design, and irrelevance. Notice that none of them is “too cheap.” A well-made inexpensive item survives all three. A badly specified expensive one fails all three.
How many should I order the first time?
Order enough to cover the venues or events you’ve actually confirmed — plus a buffer. Items break, go missing, and venues open second locations. If you kept the written spec, a second identical re-order is usually cheaper than one inflated first order.
Do promotional products need certification?
Food-contact items do, and the paperwork depends on the material and the destination market. Ceramics, glass, stainless steel, plastics and PVC each trigger different requirements. Write the item’s material into your PI, then ask which named test report ships with the goods. See our promo material guide for the material-by-material breakdown.
How far ahead should I order?
Work backwards from the date the items must be at the venue, including freight. A typical Chinese factory schedule runs roughly seven days for sampling and 25–35 days for bulk production on something like a bar mat, project-dependent. Then add artwork approval, which is the delay most buyers actually hit. Our lead time guide lays out the full schedule.
Put This Into Your Next Order
Most of the advice on this question is a list. A list won’t tell you what to buy, because your list depends on three things nobody else can fill in: which job you’re buying, who ends up with the item, and how long it stays in service.
Start there:
1. Write down the job — reach, daily habit, or purchase intent. 2. Decide who keeps it — your consumer, your trade customer, or your venue. 3. Ask for two quotes at two different specs on the same item, then compare those rather than comparing categories.
We’ve supplied beer promotional products and POSM for brewers, distributors and agencies for 14 years — across bar and serving, outdoor and event, and retail display.
Send us your brief — channels, venues, quantities and dates — and we’ll come back with a category shortlist, two spec levels and a landed-cost estimate. Request a quote, or read how we handled a Heineken campaign in Brazil and other beer promotion case studies.
Sources used in this article:
- Advertising Specialty Institute (ASI), Global Ad Impressions Study, 2026/2027 Edition (©2026 ASI, “Research provided by the Advertising Specialty Institute”). US findings read from the publisher’s own PDF: p.6 overall averages, pp.8–10 preferred products and business benefits, pp.13–31 category data. All figures in Sections 1 and 2 come from this report, not from anyone quoting it.
- PPAI (Promotional Products Association International), Product Power 2026, published 8 December 2025, based on more than 5,000 US respondents. Read at ppai.org, October 2026.
- Brewers Association mid-year 2026 report, published 22 July 2026, covering 600-plus breweries; and the Brewers Association / Harris Poll 2026 consumer survey of more than 2,000 adults.
Cost per impression figures are modelled estimates from industry research, not measured counts. Use them for comparison, not reporting.