Most promotional product trend lists tell you the same six things. Sustainable. Personalized. Premium. Tech-enabled. Useful. Practical.
That list is not wrong. It is just useless on a purchase order.
Here is the more useful version. I pulled the 2026 industry data first. Then I kept only the trends that change what a beer or drinks brand actually buys. I also kept what changes on the supplier quote when you ask.
The headline first. Drinkware sales have now fallen for two years running as a share of the US promotional market. That sounds bad for anyone selling beer buckets and tumblers. It is not. It is a buying pattern change, and the same data says drinkware is the most-kept category people receive. Read both halves of that before you panic.
What are the biggest promotional product trends in 2026?
Here are the ones with real movement behind them. Every figure below carries its source and date.
| Trend | What changed | What it means for your order |
| Quality over volume | Fewer units, better product | Unit price up, order size down |
| Personalization at scale | Names and codes printed per unit | Setup cost, then cheaper per unit |
| Useful beats novel | Keep rate is the metric | Stop buying giveaways that die in a drawer |
| Sustainability with proof | Certificates, not adjectives | Ask for GRS or RCS paperwork |
| Print on demand | Smaller runs, on-demand runs | MOQ floors dropped |
| QR and NFC on product | Scan points, not decoration | Need a landing page before you print |
| Sourcing moved | Two-origin planning | Quote validity shrank |
Read that table before you read the sections. Every row below expands on one line of it.
Why are drinkware sales falling while drinkware stays popular?
ASI published its 2026 State of the Industry report on August 20, 2026. It is the 49th edition, built on surveys of the trade.
One product finding matters to every drinks brand. T-shirts remain the number-one category. But drinkware declined for the second consecutive year, and writing instruments dropped 1.3 percentage points. The categories gaining ground were the practical, lifestyle ones: housewares and tools, blankets and towels.
Now put that next to the consumer data. ASI’s 2026 Ad Impressions study covers the US, Canada, 21 European countries and Mexico. It found that 87% of people keep a drinkware item because it is useful. That was the top keep reason of any category. Only 41% said they were keen to receive one.
So the same category is falling on the sales chart and topping the usefulness chart.
What that means in practice: nobody stopped wanting a good cup. What stopped is handing out bad cups in bulk. The trend is not away from drinkware. It is away from thin, logo-stamped, forgotten drinkware.
Which trends actually change what beer brands buy?
Trend 1: Fewer units, and better ones
Across the promo industry, roughly 90% of distributors raised prices in 2025, by an average of 11%. Two thirds of suppliers did the same, according to ASI Research.
North American promo sales still hit a record $27.7 billion in 2025, up 4.2%. Read that line carefully. The record was mostly price, not volume. That warns anyone budgeting merch on unit cost alone.
What this means for you: if your supplier holds unit price flat for two years, ask what changed upstream. A real quote should move. Ask what sits behind the number: material, freight or duty.
Trend 2: Keep rate replaces giveaway count
ASI research puts the cost of impressions in useful terms. A $6 tote bag delivers close to 5,000 impressions over its life, at roughly one tenth of a cent each. A $13 baseball cap lands near three tenths of a cent. Fleece and outerwear stay under four tenths of a cent because people keep wearing them.
What this means for you: price per impression beats unit price. Ask your supplier which of their products hold a high keep rate. If they cannot say, that is the answer.
Trend 3: A name on every single unit
Variable data printing, DTG and laser engraving all got cheap enough this year that per-unit names stopped being a luxury. ASI’s international study found something buyers miss. In Europe, 65% of people said quality decides whether they would buy an item, against 38% for design. In the US the gap was only 55% to 50%.
What this means for you: personalization is the visible part. Quality is what converts. Do not trade one for the other, and check who owns the setup cost.
Trend 4: Print on demand and the MOQ floor falling
This trend hits a first-time buyer hard. Factory-direct MOQs sat at 1,000 units a few years ago. Many vendors now top out around 200. Custom sizing that used to start at 5,000 now runs 500 to 1,000.
Three things drove it. Factory overcapacity from the 2022 to 2024 China-exit wave. Digital spec and proof systems that make small runs workable. And sample lines doubling as small-batch lines.
Bags and apparel saw it first. Treat it as a direction, not as a promise for your category. Get the current minimum per model in writing before you accept a number.
Trend 5: Green claims that come with paperwork
“Sustainable” is turning into a liability word. The EU Green Claims Directive and the US FTC Green Guides both push buyers toward real numbers instead of adjectives.
The 2026 version of ASI’s consumer study found a rise. More people than ever say a sustainable, responsibly made, or locally made item makes them like the brand more.
What this means for you: the only claims that hold up are recycled content with a percentage, plus a certificate like GRS or RCS. A bag described as “30% recycled cotton, GRS certified” survives an audit. A bag described as “eco” does not.
Trend 6: QR and NFC need a destination before artwork
The QR code stopped being a black square stuck on a label. Brands now design it into the product, and the scan target is changing: a playlist, an AR filter, a gated video, a discount.
What this means for you: do not approve artwork until the landing page exists and works on a phone, on a wet table, in bad light. A QR that 404s costs you the whole print run.
Trend 7: Two-origin sourcing as normal planning
This is the trend buyers in your position feel most in the invoice. U.S. customs revenue went from about $71.5 billion in 2024 to more than $265 billion in 2025, a 271% jump, according to the U.S. Bureau of the Fiscal Service. The effective tariff rate went from roughly 2.6% at the start of 2025 to as high as 17% in April, when China-specific rates peaked at 145%. After a February 2026 Supreme Court ruling and a global 10% rate, the current effective rate sits near 12.2%, per The Budget Lab at Yale.
New Section 301 duties took effect on July 24, 2026, adding 12.5% on goods from China and 10% from India, according to PPAI Media.
China’s share of US imports fell from about 13% monthly in 2024 to roughly 8.5% in the second half of 2025, per USITC data. ASI’s State of the Industry found 30% of suppliers strongly agreed they are actively exploring new sourcing countries. That is the highest share in five years.
But here is the part most trend articles skip. Apparel and textiles moved relatively easily to Bangladesh, Vietnam and Central America. Hard goods did not move. Drinks brands depend on drinkware, where comparable plants at scale simply do not exist elsewhere. Industry suppliers call the current state a holding pattern, not an exodus.
What this means for you: the hedge for hard goods is two origins with two spec sheets, not relocation. And any supplier who cannot tell you which factory makes your item, and who owns the tooling, is not managing this properly. Ask for that on a video call before you pay anyone.
What does this mean for beer brands specifically?
The beer market is going in the same direction as merchandise. That is why a general trend article is not enough.
The Brewers Association reported on July 22, 2026 that craft production fell 4% in the first half of 2026, based on 600-plus breweries. Operating breweries numbered 9,344 in June 2026, down 1.8% from a year earlier. NielsenIQ off-premise scan data was worse: BA-defined craft sales fell 5.2%.
Two numbers in that report matter more than the production figure.
Taprooms were the best-performing brewery type by volume change in the first half. Distributed draught gained half a point of channel share while packaged product lost 0.4 points. Taprooms themselves fell 2% in count, but 57% of taproom breweries reported production growth.
Drinkers moved the same way. A 2026 Brewers Association and Harris Poll survey polled more than 2,000 adults. It found 85% of craft drinkers enjoy craft beer at least monthly. That is up 10 percentage points year over year, the highest since 2019. Average brewery visits rose from 5.1 to 5.5 per year.
What this means for you: volume of merch is not the growth story. Presence in the places people still go is. Put your budget into taproom items first. Treat trade show giveaways as the smallest line on the order.
There is a second beer-specific trend worth naming. Non-alcoholic beer is the fastest-growing sub-segment in several markets. Younger drinkers move between alcoholic and non-alcoholic. Half of them, per 2026 market research.
What this means for you: a non-alcoholic line needs its own shelf presence, not a hand-written card. That means separate glassware, separate signage, separate tap handles.
What should you actually order next?
Start from the venue, not from the trend.
- Taproom and on-trade — tap handles, branded glassware, bar mats, coasters, growlers. This is where draught is growing, so this is where signage gets seen.
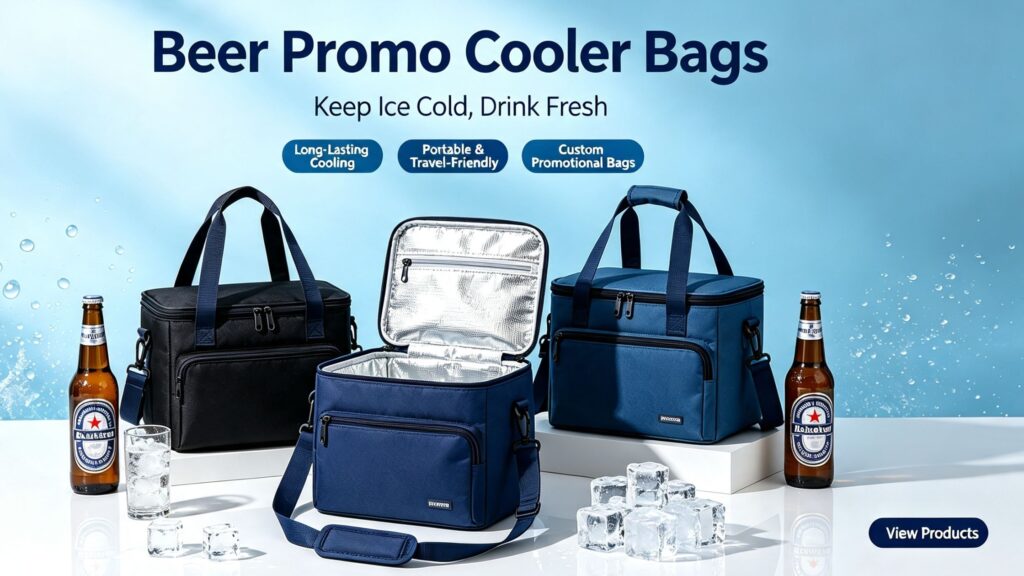
- Festivals and outdoor — cooler bags, canopy tents, patio umbrellas, beer buckets. Budget these on durability, because they get left outside.
- Retail shelves — shelf talkers, display stands, ice buckets. Here the win condition is how fast a shopper’s eye lands on the crate.
- Consumer merch — tees, hoodies, hats, socks. Move the budget from quantity to fabric weight and fit. A thin tee reads as disposable and gets donated.
- Gifting and loyalty — engraved growlers, serving trays, gift sets with kraft packaging. Low volume, high perceived value.
Three filters before anything goes on the order:
- Will someone use it at least once a week? If not, cut it.
- Can you name the keep rate? If you cannot, ask your supplier for the ASI category data.
- Do you have the landing page behind any QR code on the artwork? If not, remove the code.
Then ask for samples on the exact production spec, and approve it in writing. A re-order only compares like with like if the written spec came first.
Frequently Asked Questions
What are the top promotional product trends in 2026?
Six carry real movement. Quality over volume. Usefulness as the keep metric. Personalization at scale. Verifiable sustainability. Print on demand with lower MOQs. And QR or NFC on the product itself.
Two-origin sourcing planning is the seventh. It affects your price more than any of the other six.
Is drinkware really declining?
As a share of US promo sales, yes. ASI’s 2026 State of the Industry report recorded a second straight annual decline. But 87% of consumers keep a drinkware item because it is useful, the top keep reason of any category. The volume fell, the preference did not.
Are MOQs really lower now?
In many factory-direct cases, yes. Minimums that sat at 1,000 units often top out near 200, and custom sizing moved from 5,000 to 500–1,000. This showed up first in bags and apparel. Ask your supplier for their current per-model minimum in writing.
Should I stop sourcing promotional products from China?
No, and the industry data says not to. Apparel and textiles moved out more easily. Hard goods like drinkware did not, because there is no comparable manufacturing base elsewhere. Plan two origins with two spec sheets instead of trying to relocate. If a supplier cannot name the factory behind your item, that is the real risk.
How do I make a sustainability claim that holds up?
State the recycled content as a percentage and attach a third-party paper such as GRS or RCS. Vague green language is now a legal risk under the EU Green Claims Directive and the US FTC Green Guides, not just a marketing weakness.
Do QR codes on promotional products actually work?
They can, but they need a target. Make sure the landing page is live, loads fast on mobile, and does not need a login. Design the code into the product rather than sticking it on afterwards, and never approve artwork before the page exists.
Is personalization worth the setup cost?
It pays off for gifts, loyalty kits and staff uniforms, where you know who gets it. For event giveaways given to hundreds of strangers, variable printing adds cost that better materials usually buy back more cheaply. Check who owns the setup file before you order.
Which part of a promotional product wears out first?
Plan components, not garments. NFC chips and QR codes are the shortest-lived parts in any promo product. Ask for the shelf life of the chip and the glue, then set your own reorder date.
How do I keep a promotional product budget stable when prices move?
Ask for quote validity in writing, and ask what tariff or material clause sits behind it. Get landed cost, not unit price. Then fix your specification early, because changing material mid-season is what actually moves your cost.
Where to start your next promo order
The trend lists will tell you what is popular. What you need is the version you can put on a purchase order.
Sort your spend by venue first, then pick one trend per venue. Usefulness beats novelty in every case. And treat price per kept impression as the number you report upward, because that is the one that survives a budget review.
If you would rather have someone run the ground work, we source promotional products across Chinese factory clusters. We handle supplier checks, sample approval against your spec, and merged shipping. Send your product list, quantities per item, destination and required arrival date, and we will come back with options and a project quote.